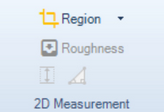
Region

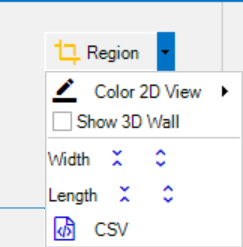
The wall color can be changed to enhance visibility.
Show 3D wall can be used to switch visualization type to a wall rendering that shows the width.
The narrow/widen buttons can be used to adjust the region.
i |
Note: that if both top- and bottom-level is set to 0, then an automatic scaling will be done. |


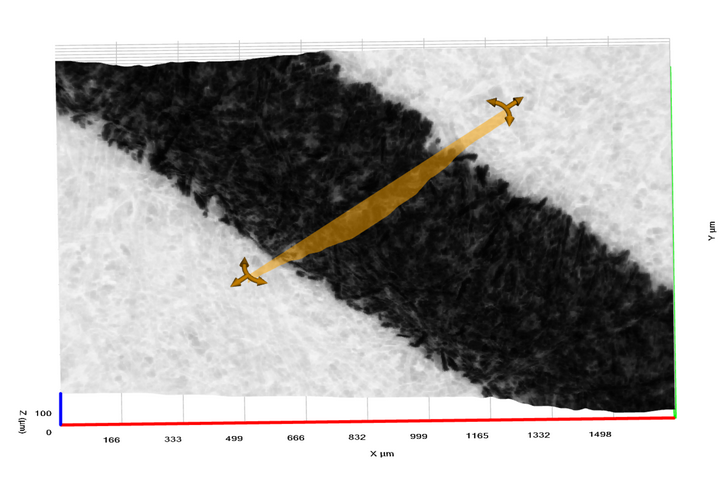
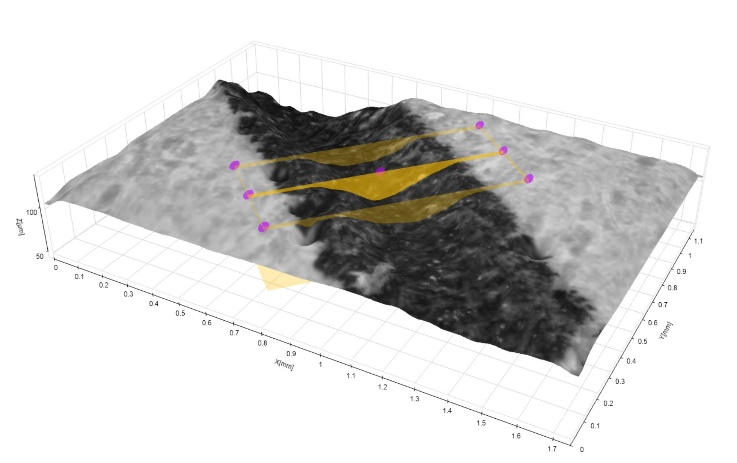
There are two different ways to visualize the 2D measurement wall. The above left image demonstrates the default, which is a simple wall without width and control handles in the upper corners for adjustment. The right image is our classic wall visualization with the bubbles for adjustment.
To move the simple region, drag the plane surface to move it. Use the control handles to rotate.
The best way to move the classic region is by mouse dragging the control bubbles. The control bubbles automatically show up when the mouse is moved within the 3D chart. The bubble color is always a ‘complementary’ color to the region color.
•The 4 corner points control the width and length of the region.
•The 2 midpoints control the length and angle of the region.
•The center point controls the overall position.
Mouse wheel control
Optionally the 2D region can be modified by the mouse wheel + a modifier key:
•Wall X position: Mouse Wheel + Shift
•Wall Y position: Mouse Wheel
•Wall Length: Mouse Wheel + Ctrl + Alt
•Wall Separation: Mouse Wheel + Ctrl
•Wall Angle: Mouse Wheel + Alt