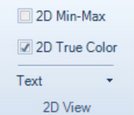
The 2D view offers a few options.

2D Min-Max
The 2D profile data is an average of the values inside region.
The display of min/max adds two curves to the 2D profile - the minimum and the maximum values used for the average calculation.
2D True Color
The 2D profile can be displayed as a plain line curve.
Alternatively, the 2D profile can be displayed using its real color, as shown on the 3D surface plot.
Texts
Header and footer texts can be added.
Annotations can be added by right clicking on a position on the 2D profile.
The callout will contain XYZ-information and the text in the ‘Callout Text’ text-box.
By mouse pointing the 3D line chart, the XYZ data is shown.
To add custom text to an annotation box, first select the annotation by clicking it with a mouse button. When selected, the color will change. Then type the text in the textbox.