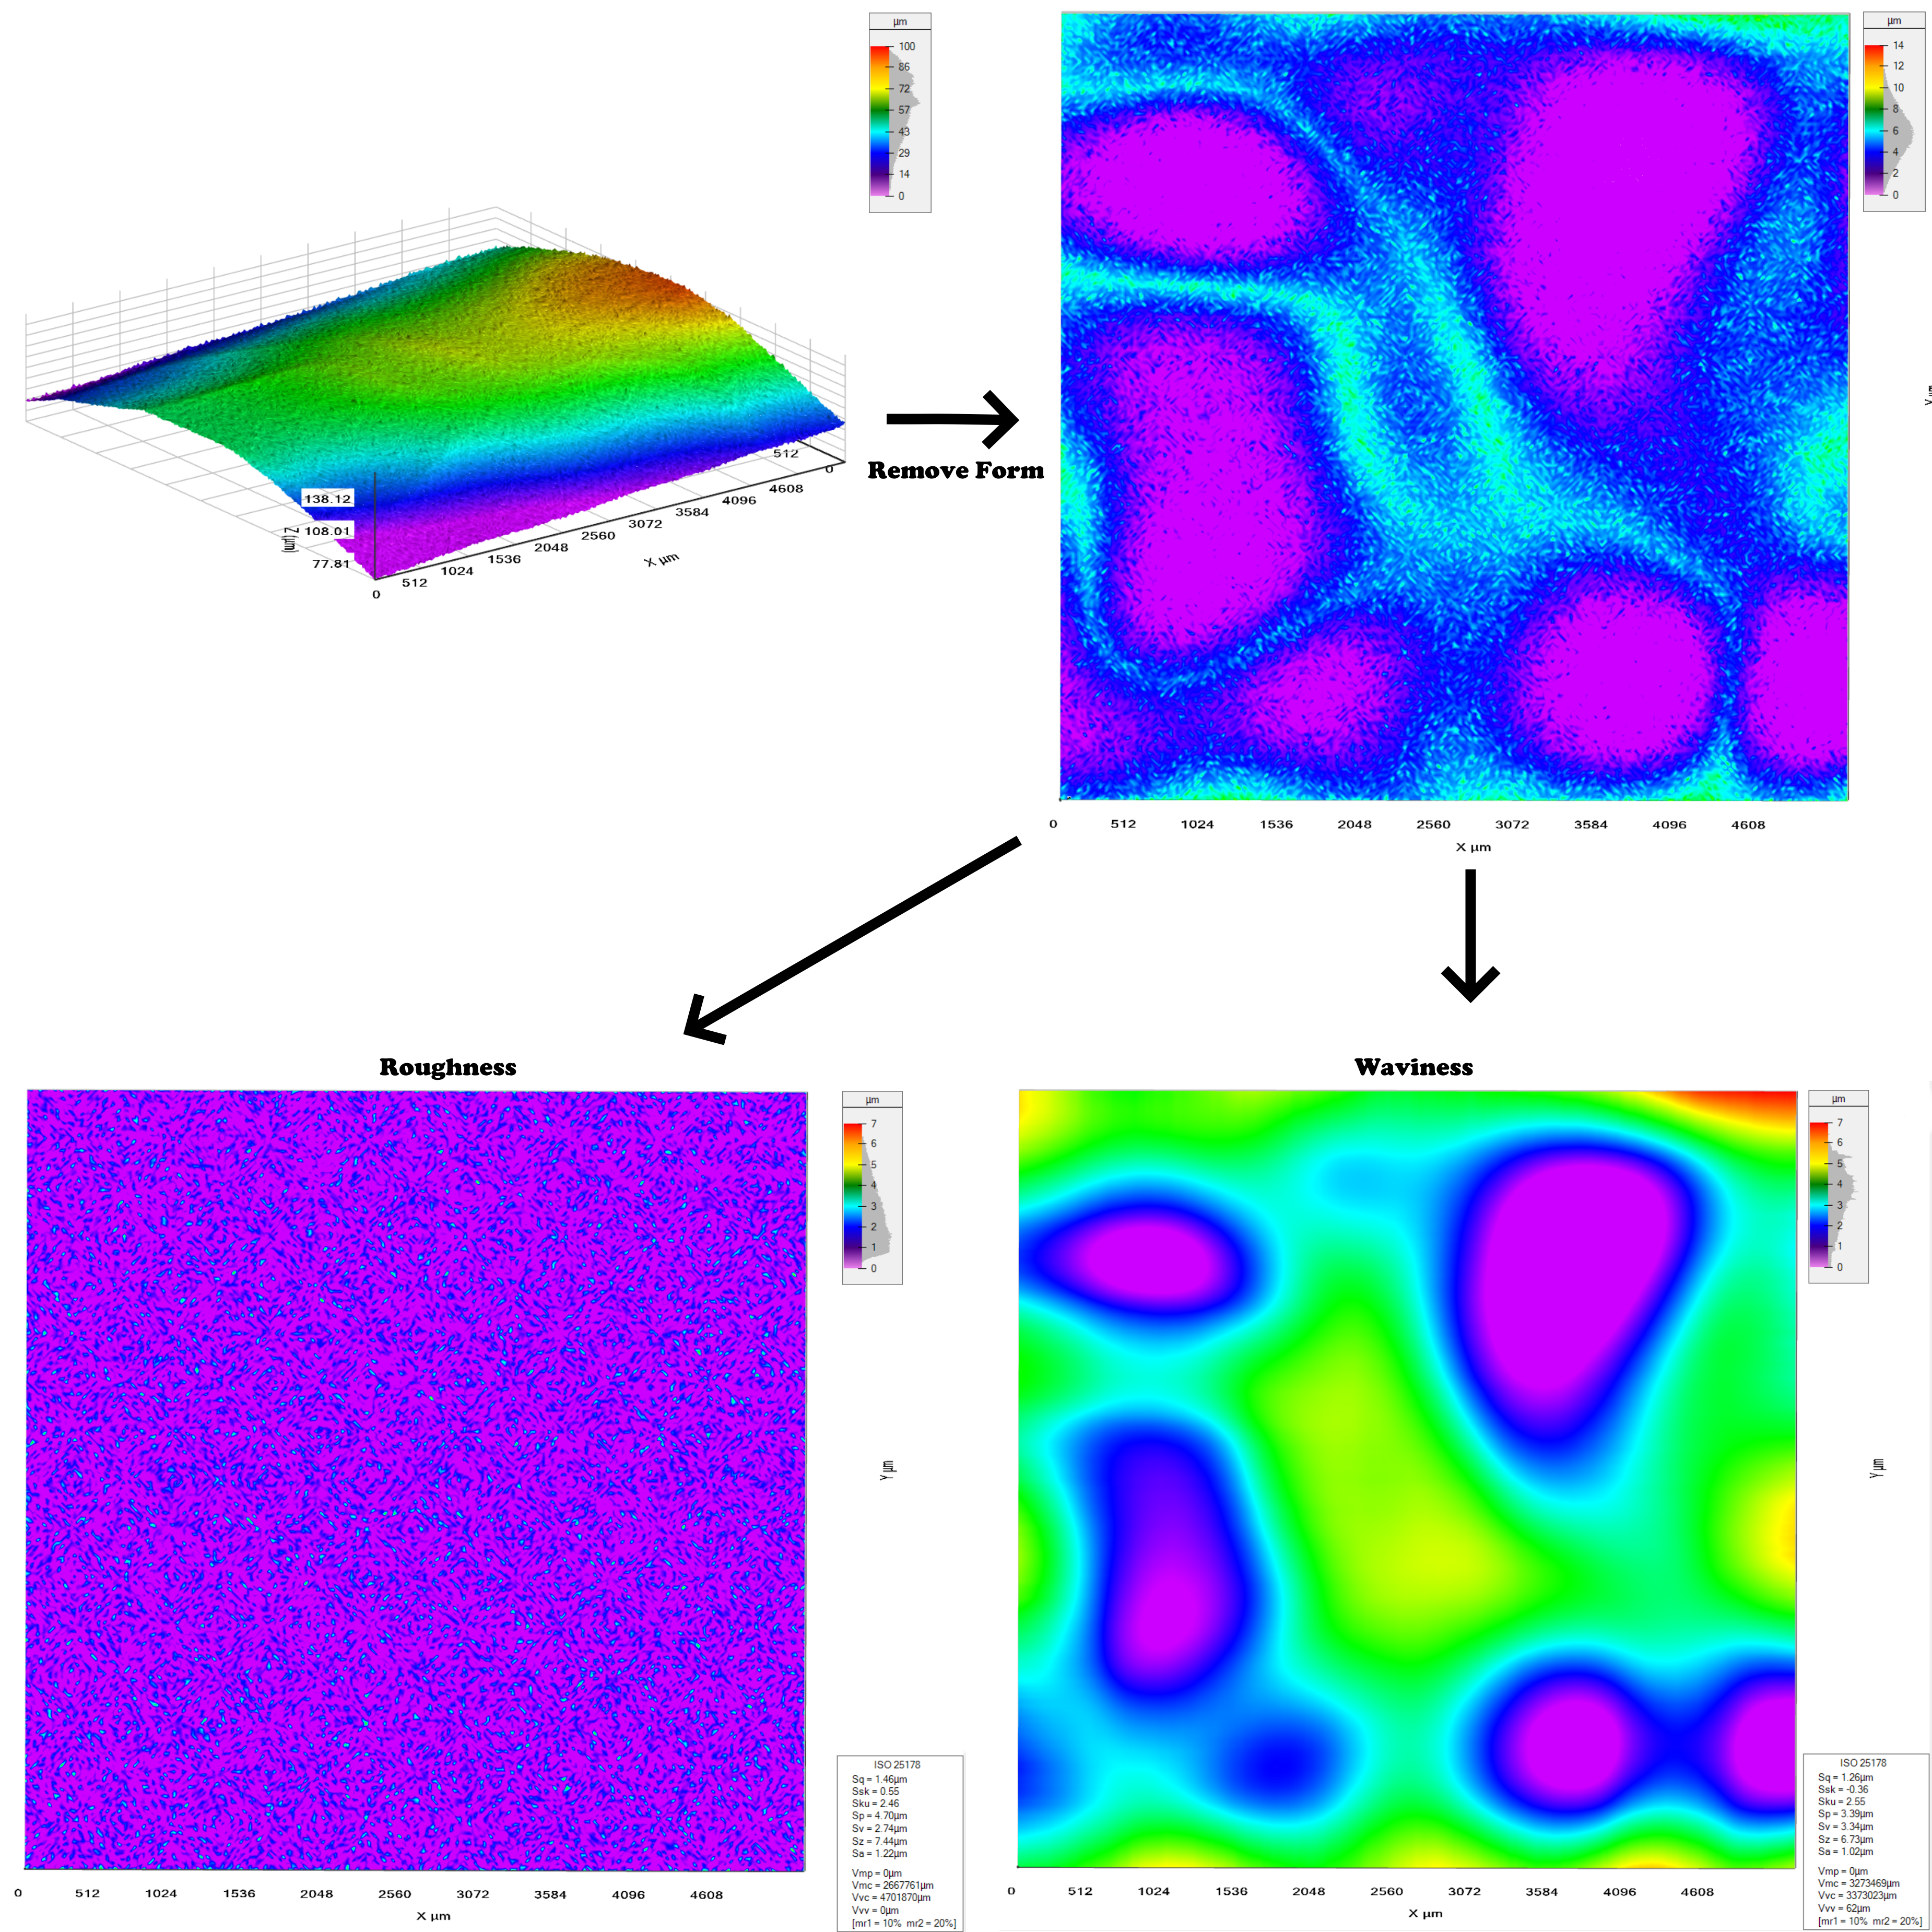
Measuring the Surface Texture parameters should be considered as a workflow. First the surface should be leveled and have its form removed. Afterward the surface should be filtered with an LS filter to separate the roughness component from the waviness component.
Remove Form
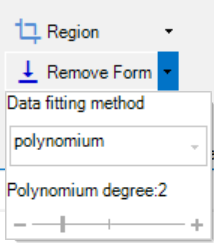
To ensure that the sample is leveled and flat, the Remove Form feature should be used. The feature will fit a geometric function to the data and substract this from the surface to remove the form and level it. The supported fitting methods are: Plane, Sphere, Cylinder and Polynomium. If polynomium is selected the degree can be specified. A polinomium with a degree of 2 is often a good option, but if you know that your data is e.g. a tilted plane you can choose plane instead.

Using the feature will result in a new tab where the new surface with form removed is shown.
Surface Texture
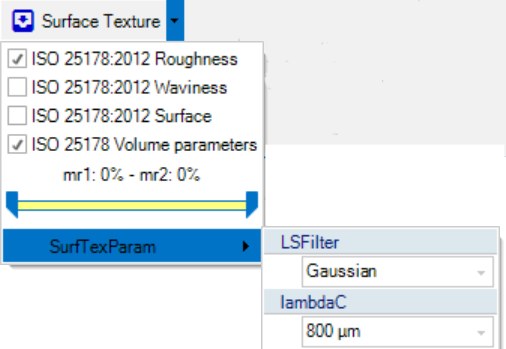
To measure the surface texture it is very important to choose a good cutoff wavelength for the LS filter. The value should be chosen so it separates the roughness and waviness without distorting the two components. If the cutoff value can not be chosen from knowledge of the sample, it is recommended to try several values and inspect the resulting waviness and roughness surfaces. The cutoff is chosen under the surface texture parameters, where filter type can also be chosen. Currently Gaussian and double Gaussian is supported.

The check boxes can be toggled to decide which output surfaces that should be produced and if volume parameters should be measured or not. Each check box will result in a new surface tab. The check box named Surface corresponds to not applying filtering and measuring directly on the surface.
Roughness volume parameters
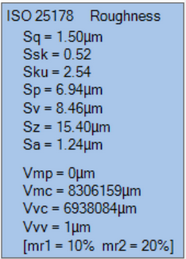
The Surface Roughness implements a subset of ISO 25178
Height and volume parameters can be selected via the drop-down check boxes.

The volume parameter calculation offers settings for the mr1 and mr2 input parameter.
The parameters are associated to a topographic 3D image - data shown in a panel in the lower right corner.

Sample roughness date
The entire workflow is illustrated in the diagram below, where a synthetic cylindrical surface with roughness and waviness is loaded. First the form is removed using a second degree polynomial. Then the roughness and waviness is seperated with a 100µm cutoff lambda and
